The Big Economic News The Media Keeps Missing
Published Friday, October 6, 2017 at: 7:00 AM EDT
Seventy-one-year-old Federal Reserve Board Chair Janet Yellen, a professor of economics at Harvard and Berkeley for four decades before her appointment to lead the Fed in 2014, admitted at a press conference recently that the persistently low rate of inflation was a mystery.
So, it should not be a shock that the financial press is missing the story of the year: Real wages soared yet again in September.
The economy is hard to understand and the press is bombarded with distractions. Just look at the headlines today.
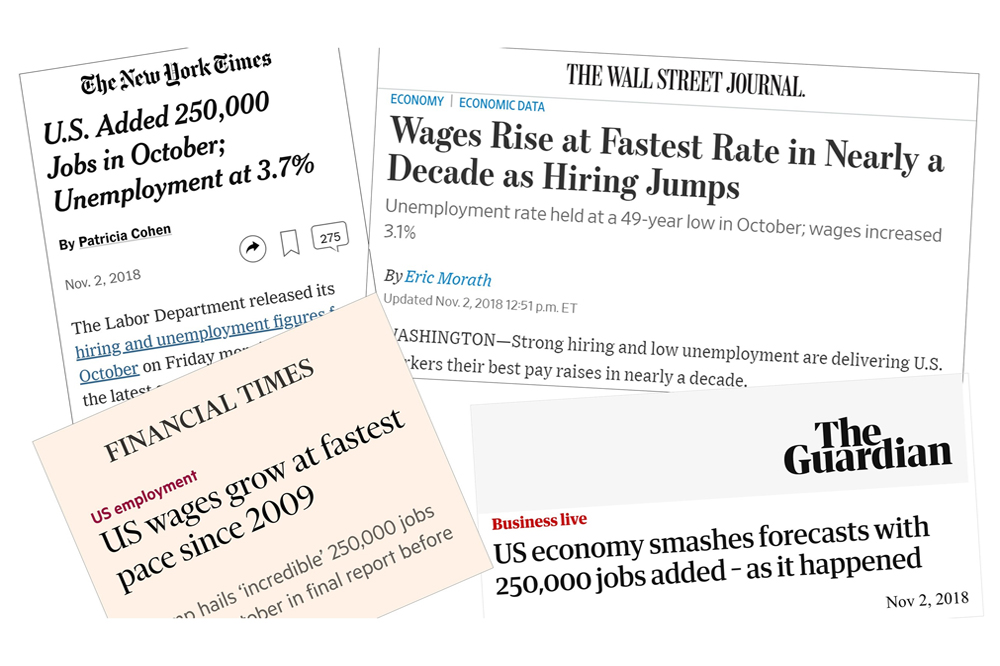
As this week closed, economic news coverage at major media outlets focused on the Labor Department's release Friday morning showing new job formation plunged in September. The bad news was expected following severe hurricanes in Texas and Florida in September but this was the top story of the moment on Friday.
In addition, other data the Labor Department just released showed the official unemployment, the U-3 index, declined to 4.2% from 4.4% in August, a record new low in modern U.S. history.
Additionally, the U-6 index of unemployment, dropped to 8.3% and is approaching the low of 7.9% set back in in the boom of 2006. The U-6 index captures workers so discouraged about the jobs situation that they've stopped looking for employment. U-6 has been very slow in declining to the low level reached in the last economic boom.
The other good news that hit with Friday's employment report was that number of Americans employed part-time for economic reasons dropped again. This segment of the labor force was slow to recover from The Great Recession. It includes the legions of college graduates who were forced to settle for part-time jobs as baristas at coffee shops. The decline in employment of workers who took part-time jobs because they were unable to find a good paying full-time job is significant. This data indicates the generation of graduates who were forced to return to live with their parents after college has largely found good paying jobs.
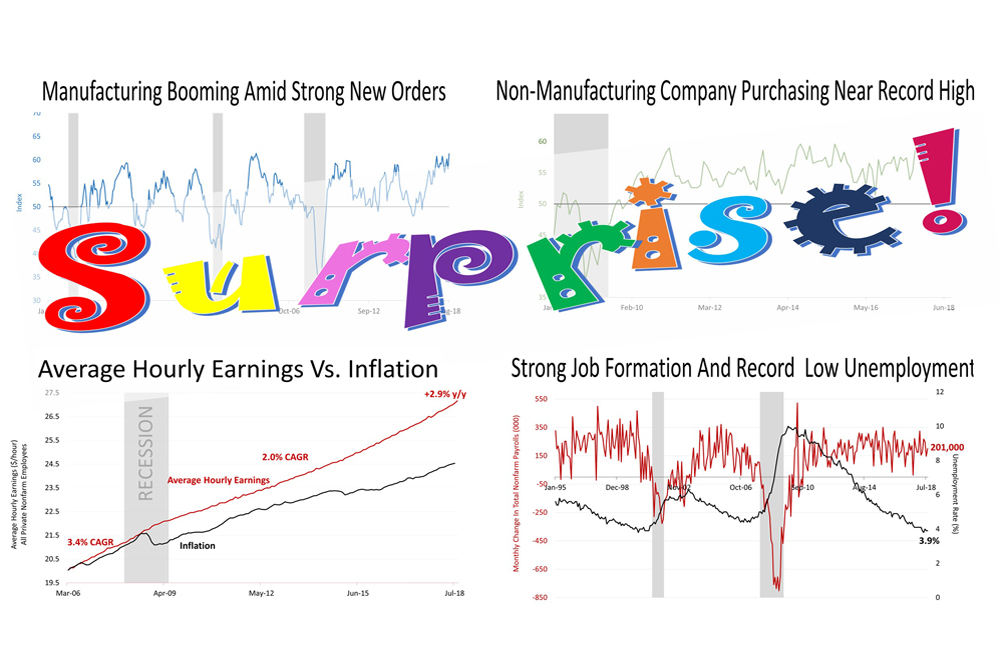
Another release grabbing headlines on Friday is that the index for measuring activity by purchasing managers at manufacturing companies soared to 60.8% - a high not seen in 13 years. In addition, the new orders component was a strong 64.6%, a surge from 60.3% in August.
This indicator collapsed well below 50 when the economy was about to head into a recession. Nothing like that is happening now.
Meanwhile, the survey of purchasing managers at non-manufacturing companies, which captures 88% of U.S. economic activity, hit 59.8% in September. Since the inception of this index in January 2008, this is a new high. In addition, new orders - one of 10 components that makes up the index of purchasing activity in non-manufacturing, soared from 57.1% to 63%, suggesting a surge in growth was making its way into the order pipeline at large companies.
All of this growth is coming as a surprise to many. But it lines up with the growth in real wages, which is the story the media is largely missing.
The government doesn't provide a monthly data series showing real wages through the decades. Perhaps that's why the media has ignored the fact that real wages are strong after accounting for inflation.
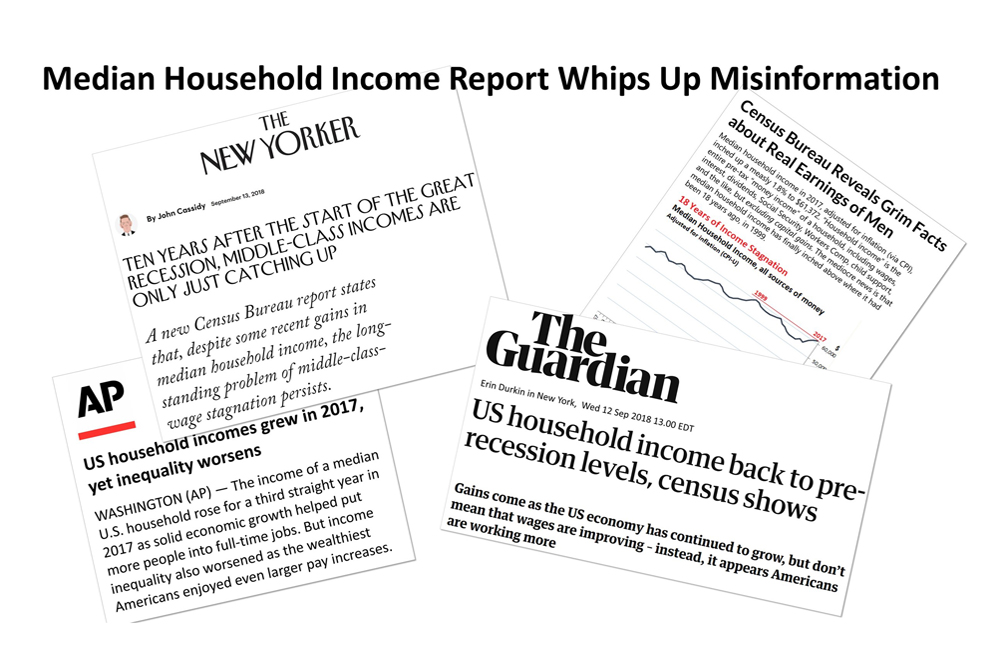
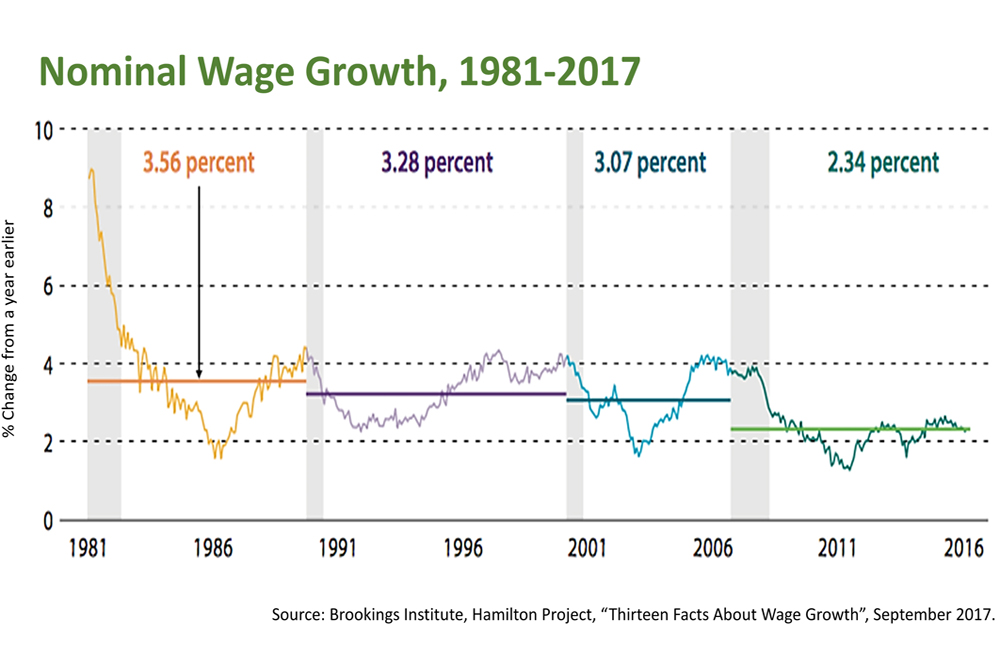
While the media often reports that wages have remained sluggish, they are reporting on nominal data. What matters most is real wage growth after inflation.
That's what's shown in this recently published chart from the non-partisan Brookings Institution. Real wage growth over this current expansion has been growing faster than during any economic expansion in modern U.S. history.
It's a story that the media has almost totally missed because the economy is complicated and it's hard to know what to focus on. But real wages, a major driver in real spending by consumers, who account for 70% of U.S. growth, is propelling growth in the economy and boosting profits for businesses.
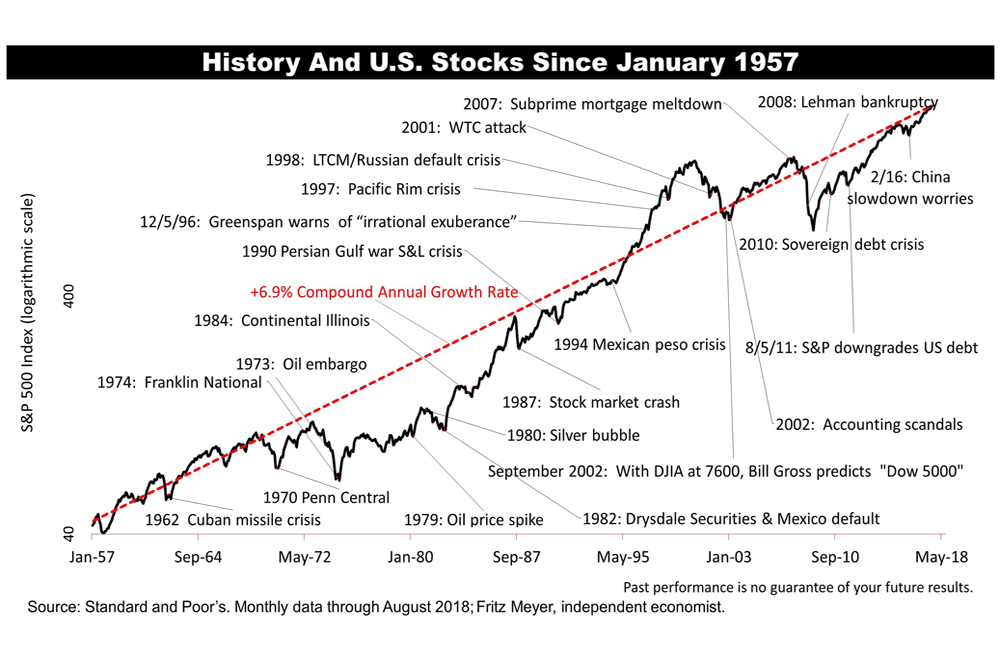
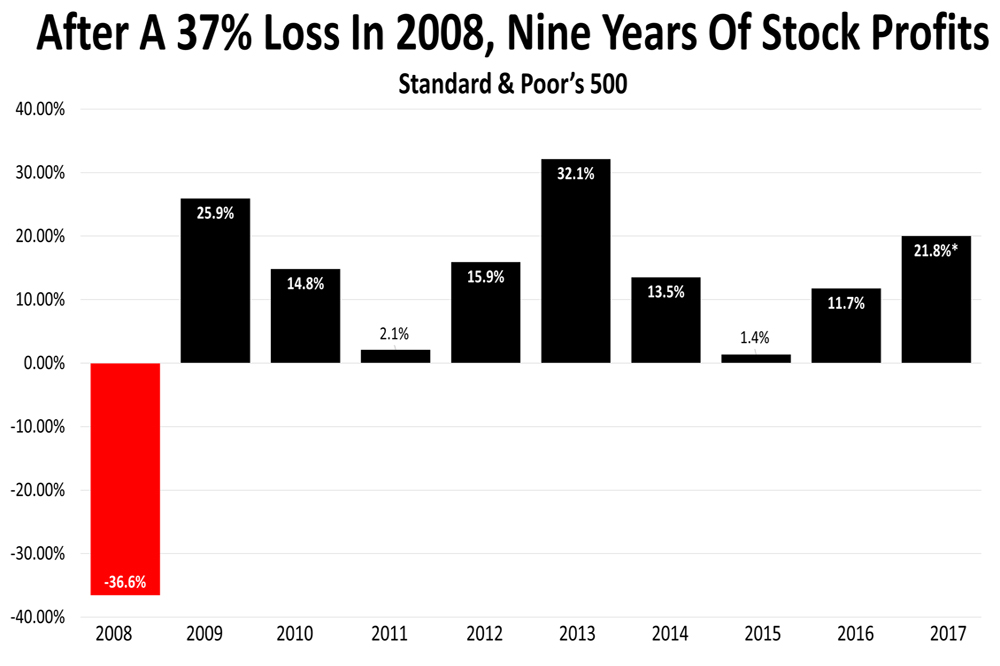
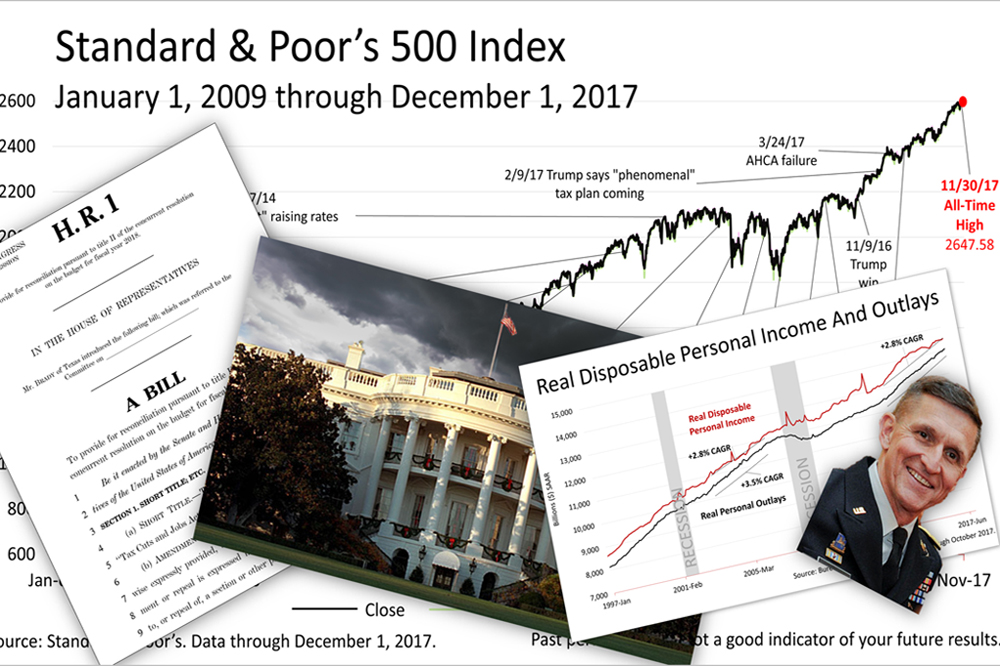
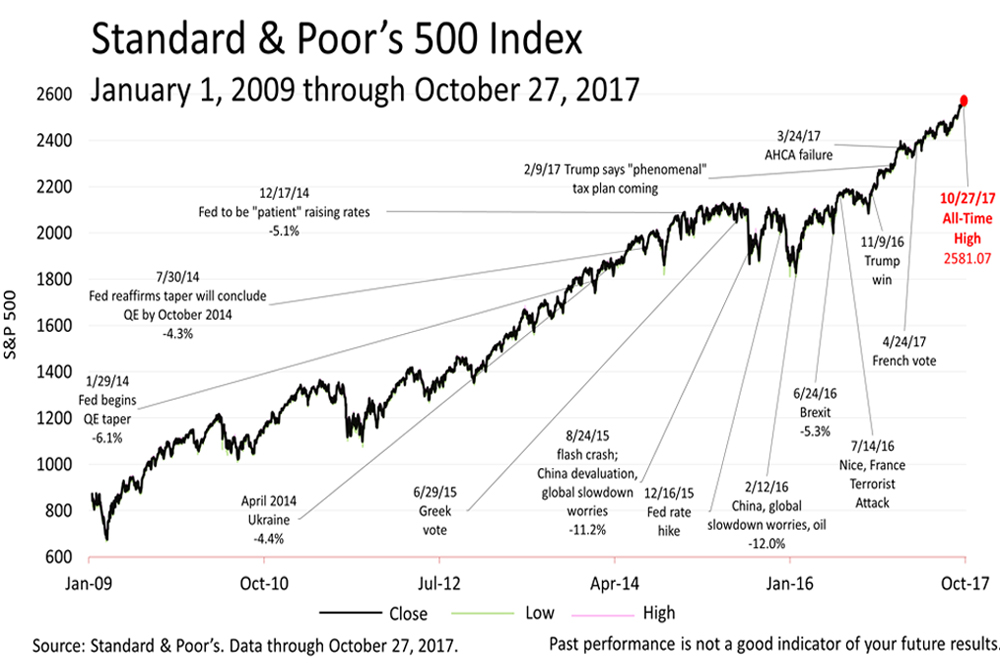
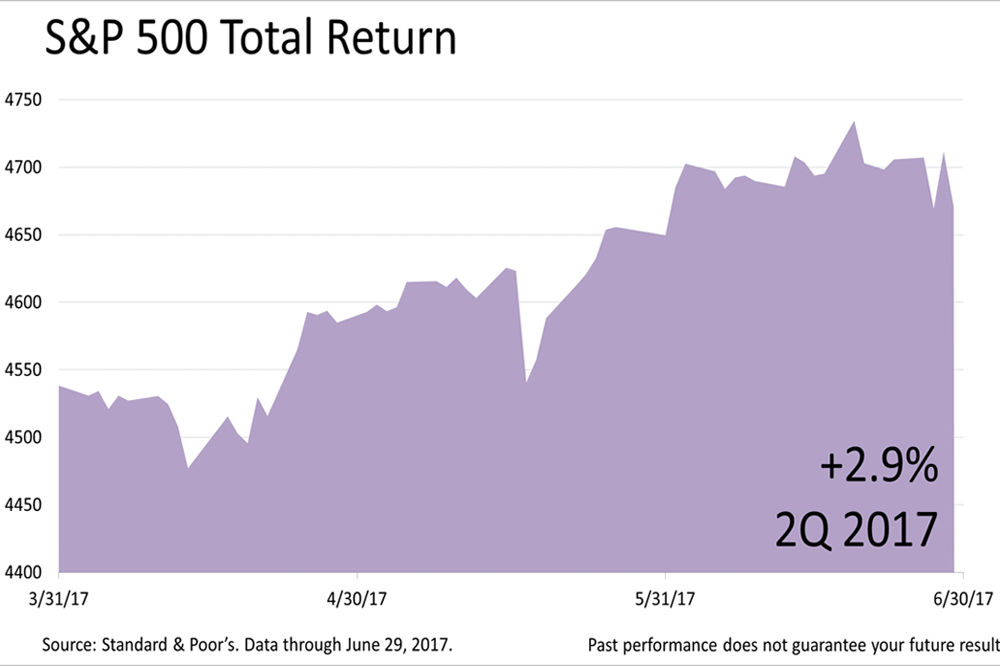
With the Standard & Poor's 500 stock market index closing Friday at 2549.33, it was fractionally off a new all-time high hit just a day earlier - the second record breaking week for the index in a row. While the financial press may lose the real news happening in the economy because the world is so complex and it's so difficult to know what information is important, stock prices seem to reflect the good news.
We are independent financial professionals, communicating at a frequency attuned to you.
Get financial wisdom here anytime from your smartphone, by subscribing to our e-mail newsletter.
Notes from BLS: The Current Employment Statistics (CES) program produces nonfarm employment series for all employees (AE), production and nonsupervisory employees (PE), and women employees (WE). For AE and PE, CES also produces average hourly earnings (AHE), average weekly hours (AWH), and, in manufacturing industries only, average weekly overtime hours (AWOH).
Concurrent with the release of January 2010 data, the CES program began publishing all employee hours and earnings as official BLS series. These series were developed to measure the AHE and AWH of all nonfarm private sector employees and the AWOH of all manufacturing employees. AE hours and earnings were first released as experimental series in April 2007, and included national level estimates at a total private sector level and limited industry detail.
Historically, the CES program has published average hours and earnings series for production employees in the goods-producing industries and for non-supervisory employees in the service-providing industries. These employees account for about 82 percent of total private nonfarm employment. The AE hours and earnings series are more comprehensive in coverage, covering 100 percent of all paid employees in the private sector, thereby providing improved information for analyzing economic trends and for constructing other major economic indicators, including nonfarm productivity and personal income.
AE average hours and earnings data are derived from reports of hours and payrolls for all employees. PE average hours and earnings data are derived from reports of production and related employees in manufacturing and mining and logging, construction employees in construction, and nonsupervisory employees in private service-providing industries.
BLS, BEA, Federal Reserve. PCED data through August 2017. U-3 and U-6 data through September 2017.
PCED is the personal consumption expenditures deflator. Core PCED is the personal consumption expenditures excluding the volatile food and energy categories deflator.
U-3 Total unemployed, as a percent of the civilian labor force (official unemployment rate).
U-6 Total unemployed, plus all persons marginally attached to the labor force, plus total employed part time for economic reasons, as a percent of the civilian labor force plus all persons marginally attached to the labor force.
ISM: "A reading above 50 percent indicates that the manufacturing economy is generally expanding; below 50 percent indicates that it is generally contracting. A PMI in excess of 43.1 percent, over a period of time, generally indicates an expansion of the overall economy."
This data series was created in 2008. ISM: "A reading above 50 percent indicates that the non-manufacturing economy is generally expanding; below 50 percent indicates that it is generally contracting."
This article was written by a veteran financial journalist based on data compiled and analyzed by independent economist, Fritz Meyer. While these are sources we believe to be reliable, the information is not intended to be used as financial advice without consulting a professional about your personal situation. Indices are unmanaged and not available for direct investment. Investments with higher return potential carry greater risk for loss. Past performance is not an indicator of your future results.
2024
-
 Stocks Closed At A Record High
-
 Federal Reserve Projects Strong Growth
-
 The Best People Were Wrong
-
 This Week’s Investment News In Six Charts
-
 U.S. Investor Picture Of The Week
-
 The Conference Board Backs Off Its Recession Forecast
-
 Softening Economic Data, Inflation Fears Dampen Stock Rally
-
 S&P 500 Closes Above 5000 For The First Time Ever
-
 Why America Is The World’s Economic Leader
-
 Investment News For The Week Ended Friday, January 26
-
 Why Stocks Broke The All-Time Record High
-
 A Strategic Update, With Stocks Near All-Time High And Crises Unfolding


